
robotics-university.com | Hello my friends, on my previous article, I
have explained about MQTT protocol. Today, I will guide you to know how to
publish sensor data to Internet of Things (IoT) cloud platform using MQTT
protocol and then monitoring the real-time sensing data on the IoT cloud
latform dashboard. For this project, I use Adafruit IO cloud platform (www.io.adafruit.com). To know the details, read this article completely and follow the steps for
your practice.

Project Description
On this project, we will build a temperature and humidity wireless sensor
device that built with DHT22 sensor module and ESP32 IoT board, so, it has
ability to publish the detected temperature and humidity sensing data
wirelessly when it placed on an internet network (WiFi).
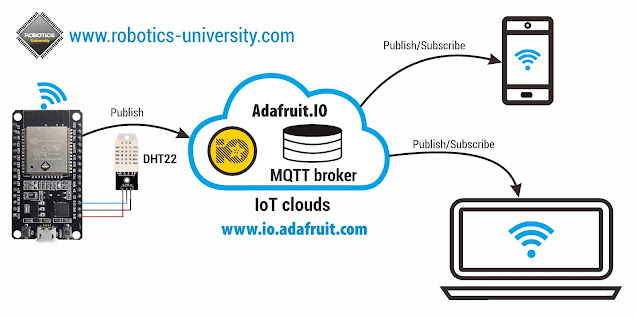
Figure 1. Project block diagram
The project block diagram as shown on figure 1. On this project, there is a
temperature and humidity sensor (DHT22) and ESP32 IoT board that will have
function as the system gateway to publish sensing data to Adafruit IO clouds.
The real-time sensing data can be accessed by smartphone or computer that has
access to login into the Adafruit IO dashboard.
Hardware Needs
- DHT22 - Temperature & Humidity sensor module
- ESP32 DevKit V1 board
- USB cable
- Jumper cables
Software Needs
- Arduino IDE
- Arduino IDE - Serial monitor
- Library (SimpleDHT, Adafruit_mqtt, WiFi)
Step 1: Create Account on Adafruit IO Website
Adafruit provide free cloud storage for everyone who want to try built an IoT
project for learning or prototyping purpose. To get started create an account,
visit the Adafruit official website (www.io.adafruit.com), then click “Get Started for Free” button on the right-top corner and then
follow the sign-up steps and requirements. See figure 2 and figure 3!

Figure 2. Adafruit IO official website

Figure 3. Sign up (create account) page of Adafruit IO official website
Step 2: Login to Adafruit IO Account
If your account has created successfully, next, please login (Sign in) on
Adafruit IO website using that account.

Figure 4. Sign in on Adafruit IO official website

Figure 5. Sign in page of Adafruit IO official website
After login, we will know that Adafruit IO free account has some
limitation.

Figure 6. Adafruit IO free account limitations
For a free account, Adafruit IO has limitation as follow (See table 1):
Table 1. Adafruit IO free account limitation

With that limitation, for learning or prototyping purpose, perhaps the limit
feature of Adafruit IO clouds platform has been enough. But for business or
real IoT or Home automation project, we have to upgrade it to IO+ version of
Adafruit IO (See figure 6 or figure 7).
Step 3: Create Project “Feeds”
The next step is get started to create project dashboard. But before it, you
have to create the project “Feeds.” What is Feed? Feed is a variable on
Adafruit IO clouds that have function to store data that published by a device
(in this case, sensor gateway, i.e. ESP32 board) of a system in data publish
operation.

Figure 7. Select “Feeds” menu
To create project Feed, on the top menu, click “IO” menu, then “Feeds” menu.
See figure 7!

Figure 8. View All project “Feeds”
After that, “Feeds” page will be open (See figure 8), then click “View all” to
open a list of Feeds that has created, if there are another feeds has created
before. But if there are no available feeds, it’s means, the feed that will
you create is the first feed. To get started create a feed, click “Action”
drop-down option, then select “Create a New Feed” (See figure 9).

Figure 9. Create new project “Feeds”
Type your feed name (in this case, Temperature) in the name field, then click
“Create” button (See figure 10). The maximum length of the feed name is 128
characters only.

Figure 10. Create feed - named “Temperature”
After “Create” button clicked, on the feed list will be created “Temperature”
feed. See figure 11.

Figure 11. A feed named “Temperature” has created
Do the same steps, to create the other feed for this project (Humidity feed).
See figure 12 and figure 13.

Figure 12. Create feed - named “Humidity”

Figure 13. A feed named “Humidity” has created
Step 4: Create Project “Dashboard”
After you have created feeds for this project, the next step is creating
Dashboard. Dashboard is a web-based user interface (UI) page on your Adafruit
IO account that make you can monitor data from sensor device (subscribe) or
control actuators that installed on the sensor device (publish) from your
smartphone or computer.

Figure 14. Select “Dashboards” menu
To get started create Dashboard, on the top menu, click “IO” menu, then
“Dashboards” menu. See figure 14!

Figure 15. View All project “Dashboards”
After that, “Dashboards” page will be open (See figure 15), then click “View
all” to open a list of Dashboard that has created, if there are another
Dashboard has created before. But if there are no available Dashboards, it’s
means, the dashboard that will you create is the first dashboard. To get
started create a dashboard, click “Action” drop-down option, then select
“Create a New Dashboard” (See figure 16).

Figure 16. Create new project “Dashboards”
Type your Dashboard name (in this case, Temperature & Humidity Monitor) in
the name field, then click “Create” button (See figure 17).

Figure 17. Create dashboard - named “Temperature & Humidity Monitor”
After “Create” button clicked, on the Dashboards list will be created
“Temperature & Humidity Monitor” dashboard. See figure 18.

Figure 18. A new dashboard has created
Step 5: Open the Created Dashboard
If your dashboard has created, to open it, just click the dashboard name. See
figure 19!

Figure 19. Open the dashboard
After your new dashboard opened, there is no available control or monitor
block yet (See figure 20), so, you have to create it with follow your project
system needs. On this case, you need two monitor blocks to show the real-time
sensing data of DHT22 sensor, i.e. Temperature and humidity sensor data.

Figure 20. Adafruit IO Dashboard opened (Temperature & Humidity
Monitor)
Step 6: Create New (Control/Monitor) Block on the Dashboard
To get started create a new block, just click “Create a new block (+)” button.
See figure 21.

Figure 21. Button to create a new block
After you press the “Create a new block (+)” button, a block option window
will open for you, So, you can select a new block (Control or monitor) that
match with your project. See figure 22!

Figure 22. Block options window
Step 7: Create Block to Monitor Temperature Data on the Dashboard
For this project, select “Gauge” block to monitor temperature data.

Figure 23. Select Gauge block for Temperature monitoring
After you select Gauge block, you need to choose a feed that you want its data
will displayed on the Gauge block that has you selected before. So, choose
“Temperature” feed! See figure 24.

Figure 24. Choose the match feed for Temperature block (Feed =
Temperature)
After you have chosen the match feed for the Gauge block, then click “Next
step” button (See figure 24), So, “Block setting” window will opened (See
figure 25).

Figure 25. Temperature block setting
Set the Gauge block parameter with follow the figure 25, after complete, then
click “Create block.”

Figure 26. Gauge block to monitor temperature data has created on the
Dashboard
If you are success, you will see Gauge block to monitor temperature sensing
data has created on the Dashboard.
Step 8: Create Block to Monitor Humidity on the Dashboard
With the same steps on the Step 6 and Step 7, create a new block for humidity
data monitoring.
- Open “block options window” by press “Create a new block” button, see figure 21 and figure 22.
- Select Gauge block for Humidity monitoring. See figure 23.
- Choose the match feed for Humidity block. See figure 27.
- Set the humidity Gauge block parameters, then click “Create block.” See figure 28.
- Gauge block to monitor humidity data has created on the Dashboard. See figure 29.
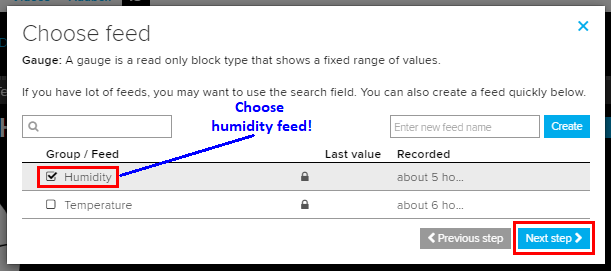
Figure 27. Choose the match feed for Humidity block (Feed = Humidity)

Figure 28. Humidity block setting
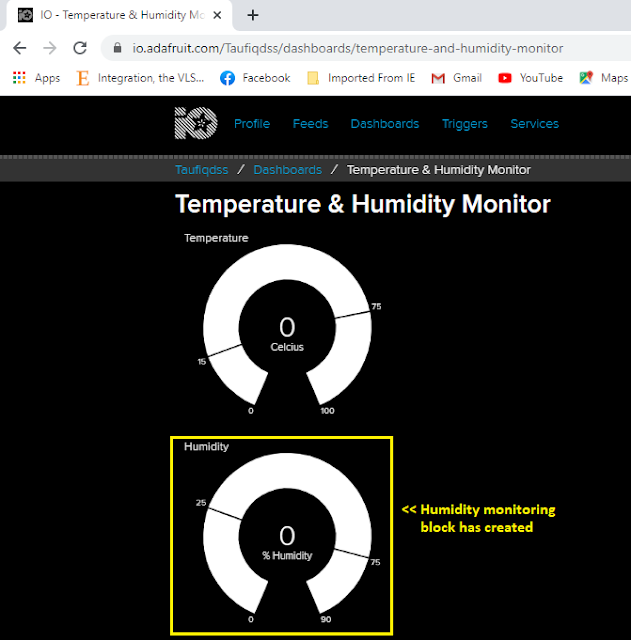
Figure 29. Gauge block to monitor humidity data has created on the
Dashboard
Step 9: Dashboard Layout Editing
If you want to edit the blocks layout on your dashboard, you can do so with
follow the steps below.

Figure 30. Edit Dashboard layout button
Click “Edit Dashboard layout” button so on each corner of the Gauge block will
available “Corner blue marking,” that signed that you can click and drag the
block to move it to another place that you want on the dashboard.

Figure 31. Blue marking on each block
For example, you want the Humidity gauge block placed on the right-side of the
Temperature gauge block, so you can click the Humidity gauge block and drag to
move to the right-side of the Temperature gauge block. Then click “Save layout
change” button to save your new blocks layout (See figure 32 and figure
33).

Figure 32. Save the new layout setting

Figure 33. The new layout setting has saved
Step 10: Take Your Adafruit IO Username & Active Key
Click “Adafruit IO key” if you want to know your Adafruit IO username and
active key. See figure 34 and figure 35.

Figure 34. Adafruit IO Key link
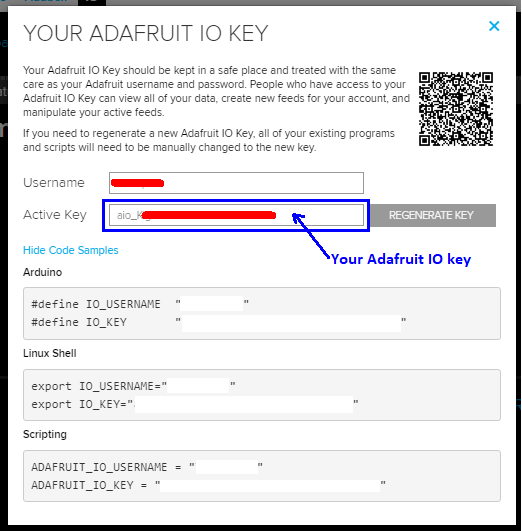
Figure 35. Your Adafruit IO Key information window
Your Adafruit IO key will be use on your program to make your device (Wireless
sensor) can be connected with Adafruit IO IoT cloud platform and publish
sensor data on it.
Step 11: Hardware (Device) Installation
For this project, the interface wiring between DHT22 with ESP32 IoT board is
as follow the figure 36 below.

Figure 36. The interfacing between DHT22 with ESP32 IoT board
That is so simple interfacing, because you need three jumper-cable only. One
for positive power supply (+3V3), one for negative power supply or GND, and
one for sensor data output (in this case, I use the D15 pin).
Step 12: Code Build & Upload Program
After you have finished create your Dashboard on Adafruit IO IoT clouds
platform, and make Interfacing between DHT22 sensor module with ESP32 IoT
board, next, build the program (code/firmware) for your sensor device gateway
(ESP32 IoT board) in order it can publish temperature and humidity sensor data
(DHT22) to Adafruit IO IoT clouds platform. Type “Program 1” below in the
Arduino IDE or actually copy and paste 😊
Program 1:
When you type your code, don’t forget to edit “Program 1” on “WiFi parameters”
and “Adafruit IO setup” sections (See figure 37).

Figure 37. WiFi parameters & Adafruit IO setup section
On the WiFi parameters section, edit WLAN SSID name and its password. Change
characters "TYPE_YOUR_WIFI_SSID_HERE", with the SSID name of your WiFi that
you use for this project. Then change characters
"TYPE_YOUR_WIFI_PASSWORD_HERE", with your WiFi password.
Then, on the Adafruit IO setup section. With refer Step 9 (Take your Adafruit IO
username & Key) above. Change characters
"TYPE_YOUR_ADAFRUIT_IO_USERNAME_HERE", with your Adafruit IO username and
"TYPE_YOUR_ADAFRUIT_IO_KEY_HERE", with your Adafruit IO active key (See "Step 10" or figure 35 above).
If you have finished on your program typing and editing, next, compile/verify
and upload your program to your ESP32 board. Then test it.
Step 13: Hardware/Device Testing
To test your sensor device hardware, open your Arduino IDE, the open Serial
Monitor that has availabled in Arduino IDE. Select “Tools” menu, the choose
“Serial Monitor” option (See figure 38).
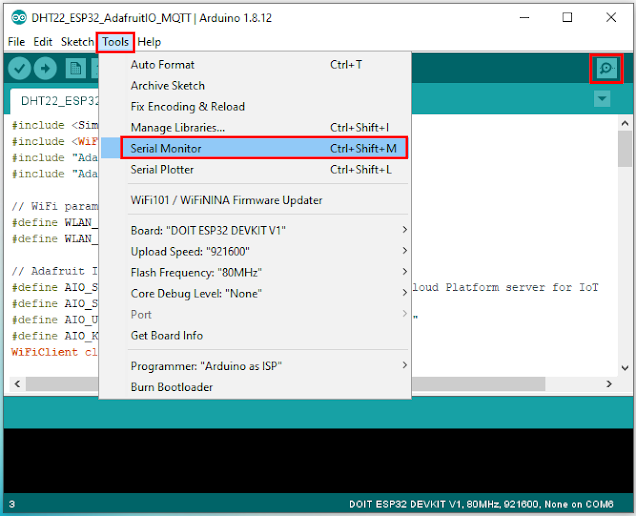
Figure 38. Step to open Arduino IDE serial Monitor
Once you click the “Serial Monitor” option, Serial monitor window will be open
(See figure 39). Then select the baud rate value on the baud rate drop-down
(in this case, the baud rate is 115200).

Figure 39. Serial monitor
If there is no error occur, on the serial monitor will displayed some
information, i.e.:
- Connected WiFi SSID.
- WiFi IP address.
- Device connection information with Adafruit IO cloud platform.
- Published sensor data (Temperature & Humidity).
Step 14: Monitoring DHT22 Sensor Data on Adafruit IO Dashboard
The last step is monitoring the DHT22 sensor data on Adafruit IO dashboard. To
make sure that the DHT22 sensor data on the Adafruit IO dashboard and on the
actual measurement place (Record on Arduino IDE Serial monitor window) have
the same value, its better if you compare the data by see the DHT22 sensor
data side by side. Either on Adafruit IO dashboard or on Serial Monitor. See
figure 40.

Figure 40. DHT22 sensor data on Adafruit IO dashboard Vs on Serial
Monitor

Figure 41. Realtime monitoring of DHT22 sensor data on Adafruit IO
dashboard
Figure 41, showed the real-time monitoring of DHT22 sensor data (Temperature
& Humidity) on Adafruit IO dashboard.
If you reach this point, congratulation!
Its means that you have published DHT22 sensor data
(Temperature and Humidity) to Adafruit IO IoT cloud platform using MQTT
protocol successfully.
0 comments:
Post a Comment