
robotics-university.com | Hello my friends, on my previous article, I
have explained about MQTT protocol. On this article, I will try to give you an
example of MQTT protocol use in a simple Internet of Things (IoT)
project.

Today, I will guide you to know: The first, how to publish sensor data to IoT
cloud platform, then monitor the real-time sensing data on the cloud platform
dashboard. The second, how to subscribe (receive) instruction from IoT cloud
platform dashboard. For the protocol, I use MQTT protocol. For this project, I
use Ubidots cloud IoT platform (www.ubidots.com). To know the details, continue read this article and follow all of the
steps for your practice.
Project Description
On this project, we will try to publish Hall-effect sensor (that built-in on
ESP32 board) data and control internal LED of ESP32 board on Ubidots
dashboard. Figure 1 is the block diagram of the project system.

Figure 1. Project block diagram
Hardware Needs
- ESP32 DevKit V1 board (Include internal LED and Hall sensor)
- USB cable
- Jumper cables
Software Needs
- Arduino IDE
- Arduino IDE - Serial monitor
- Library (PubSubClient, WiFi)
Step 1: Create Account on Ubidots Website
Ubidots provide free cloud storage for everyone that want to try built an IoT
project for learning or prototyping purpose. To get started create an Ubidots
account, visit the Ubidots official website (www.ubidots.com), then click “Get Started for Free” button.

Figure 2. Ubidots official website
After you press “Get Started for Free” button, you will ask to choose two
optional Ubidots account, i.e. “For educational or Personal use” (free
account) and “For Business.” For this project, just select the free account
option (Se figure 3).

Figure 3. Ubidots for Educational/Personal and for Business

Figure 4. Sign up (create account) page of Ubidots official website
Next, input your username, email, and password. Then press “Sign up for free”
button and your account will be created and ready to use.
For your information, on the sign-up page, you will know about the Ubidots
free account features (See figure 4), i.e.
- 3 forever free devices.
- 200+ open source device libraries and tutorials.
- Real-time dashboard with 30+ types of widget (and the tools to code your own!).
- If-Then triggers with Email, SMS, Telegram, Voice call, Webhooks, or Slack notifications.
For learning or prototyping purpose, perhaps the features of Ubidots cloud
platform has been enough. For business or real IoT/Smart Home project, we have
to upgrade it to Industrial account version of Ubidots.
Step 2: Login to Ubidots Account
If your account has created successfully, next, login (Sign in) on Ubidots
website using that account. See figure 5, figure 6, and figure 7.

Figure 5. Login button on Ubidots IoT clouds platform

Figure 6. Sign in page of Ubidots IoT clouds platform

Figure 7. Ubidots IoT clouds platform page display after login
Step 3: Create Project Device
The early step to make a dashboard on Ubidot IoT cloud platform. You have to
create your project device first. Select “Devices” menu, then choose “Devices”
option until Ubidots device page opened for you. See figure 8 and figure
9.

Figure 8. Select “Devices” menu

Figure 9. “Devices” page - Create new device
Next, press “Create Device” button on the device page (See figure 9). After
that, on the right-side of device page, will open “Add New Device” section.
Click “Blank Device.” See figure 10
Figure 10. “Blank Device” button

Figure 11. Type your device name
Then type your device name, so the device label will be generated
automatically (See figure 11). Click check button to save your device name and
label.

Figure 12. A new device has created
After that, on the device page will be created a new device on the device list
(See figure 12).
Step 4: Create Device Variable(s)
After you create your project device, next, you have to create one or more
variable that has correlation with your device. For example, on this project
you will use ESP32 board and its internal Hall-sensor and LED. So on this
case, your ESP32 board is your device, while the internal Hall-sensor and LED
are your device variables.

Figure 13. Open device page and create device variable(s)
Click your device name (See figure 13) to open device page and create device
variables. Figure 14 show the Ubidots device page.

Figure 14. Device page
Click “Add Variable” button to get started create a new device variable (See
figure 14). Once you press the “Add Variable” button, there will show two
option of variables, i.e. Raw and Synthetic. Select “Raw” if your variable is
for non-arithmetic purpose (No need mathematical formula), on the other hand,
if your variable is for arithmetic purpose, you should select “Synthetic.”
Because a synthetic variable needs mathematical formula/expression. On this
project, we will create non-arithmetic variable, so, select “Raw” type
variable (See figure 15)

Figure 15. Variable type (Raw and Synthetic)
After you select “Raw” variable, a new variable box will created on device
page (See fiure 16).

Figure 16. Created variable box
Click the variable box to open the variable page (See figure 16) and set the
variable parameters (See figure 17).

Figure 17. Parameters setting of a variable
If you have finished on set a variable parameter, click “Back-arrow” to back
to device page (See figure 17). A new ready variable has created there (See
figure 18).

Figure 18. A new ready variable has created
If you want to add a new variable again, you can add it by click “Add
Variable” again and do the same steps on this step (Step 4).

Figure 19. Device variables on this project (Hall sensor & LED)
For this project, we need two variables for one device (ESP32 board), i.e.,
“Hall Sensor on ESP32” and “LED on ESP32” (See figure 19).
Step 5: Get Your Device Label and Token
To get your device label and token, open your device page and get your both of
them on the left-side. See figure 20.

Figure 20. Device token
From figure 20 we know that:
Device label = esp32-iot-board
Device token = BBFF-RPeLfc5xxxxxw7SyyyyyyLlRlxxxxx
Step 6: Get the Variables (API) Label
To get the variables (API) label, open the variable page by click the related
variable box (See figure 20) and get your variable (API) label on the
left-side of the variable page of each variable (See figure 21 and figure
22).

Figure 21. Hall Sensor - Variable page

Figure 22. LED - Variable page
From figure 21 and figure 22, we know that:
The Hall-sensor’s variable (API) label = hall-sensor-esp32
The LED’s variable (API) label = led-on-esp32
Note for Step 5 and Step 6:Your Ubidots token, device label, and variable (API) label will be use on your program to make your device (ESP32) can be connected with Ubidots IoT cloud platform, publish sensor data on it, and subscribe command from its dashboard (See Program 1).
Step 7: Create the Project Dashboard and Add the Widget
After your device and its variables ready, next you have to create your
project dashboard and its widget. To get started create a new dashboard, click
“Data” menu, then select “Dashboards” option (See figure 23). So dashboard
page opened for you (See figure 24).

Figure 23. Step to open Dashboards page

Figure 24. Opened Dashboards page
On the dashboard page, click “Add new Dashboard” button. After that, on the
right-side of dashboard page, will open “Add New Dashboard” section. Set your
dashboard parameters (See figure 25).

Figure 25. New Dashboards parameters setting
If you have finished to set the new dashboard parameters, then click check
button to save your setting (See figure 25), so a new dashboard page created
for you (See figure 26).

Figure 26. A new Dashboards has created
A dashboard is a graphical user interface (GUI). In order the user can monitor
sensor data or control an actuator from the dashboard, so it has to equipped
with features or widget (Gauge, switch, clock, double-axis graph, slider,
thermometer, scatter, text, tank, battery, and more) to make user can do
that.
To get started add a new widget on your dashboard, click “Add new Widget”
button (See figure 26). So, on the right-side of your dashboard page, will
open “Add new Widget” section or widget list (See figure 27).

Figure 27. Widget list and add “Gauge” widget
Select one or more widget that needed by your system project on the widget
list (See figure 27). For this project, you need “Gauge”, so, click Gauge
widget. After you click the Gauge widget on the widget list, on the right-side
of your dashboard page will open “Gauge” parameter section. On there,
determine the widget behavior (Static/Dynamic) and its variable (See figure
28).
This Gauge widget has function to display the Hall-sensor measurement data
that published by ESP32 board, so, you have to determine the match variable
for this widget.

Figure 28. “Add variable” button
Click the “Add Variables” button (See figure 28), then select the match
variable, i.e. “Hall Sensor on ESP32” variable, and confirm your selection by
click the green check button (See figure 29).

Figure 29. Select the match variable for your Gauge widget (Hall sensor on
ESP32)
If you have selected the match variable, the variable will show on the Gauge
widget parameter section (See figure 30).

Figure 30. Gauge widget parameter section
After you have selected the variable, then next set the others parameters with
follow the table 1 below.
Table 1. Gauge (Hall sensor) widget parameters setting

Don’t forget to click the green check button to save your Gauge widget
parameters setting (See figure 30).

Figure 31. A new widget has created (Hall sensor widget)
Figure 31 inform that Gauge widget (for Hall-sensor) hasn’t been found data,
because still on initial condition. The figure also informs that if you want
to add a new widget again, press the plus (+) button on the top right corner
of your dashboard page.

Figure 32. Add new widget (Switch widget)
For the second widget, you need “Switch” widget, because this widget has
function as a switch to control an internal Light Emitting Diode (LED) of
ESP32 board.

Figure 33. Select the match variable for your widget (LED on ESP32)
Select switch widget (see figure 32), then determine “LED on ESP32” variable
(See figure 33), and set its parameters with follow table 2. Click the green
check button to save your widget parameters setting (See figure 34).
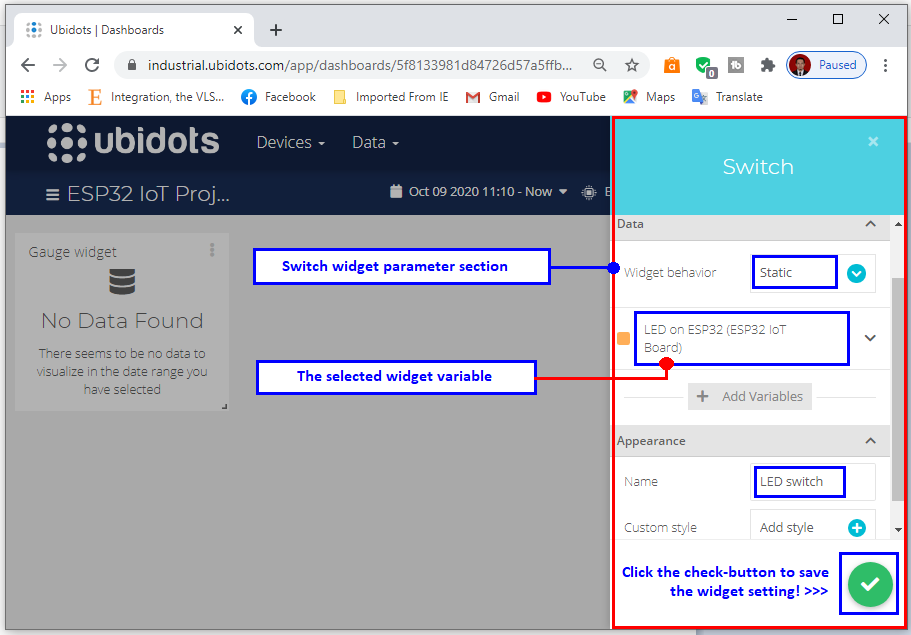
Figure 34. Switch widget parameter section
Table 2. Switch (LED on ESP32) widget parameters setting


Figure 35. The two widgets (Hall sensor & LED switch) of this dashboard
has created
Finally, your Dashboard has created. The dashboard contains with two widgets,
i.e. Gauge widget to display the real-time Hall-sensor sensing data and Switch
widget to control internal LED of ESP32 board.
Step 8: Hardware (Device) Installation
The hardware of this project is ESP32 IoT board only. The Hall-sensor and LED
have integrated on it. To program this board, you just make connection between
this board and your computer/laptop via each USB port.

Figure 36. ESP32 board with internal Hall-sensor & LED
Step 9: Code Building & Uploading
After you have finished create your Dashboard on Ubidots IoT clouds platform,
next, build the program (code/firmware) for your Hall-sensor device gateway
(ESP32 IoT board) in order it can publish Hall sensor data to IoT clouds
platform (Ubidots) and control the internal LED of ESP32 board. Type “Program
1” below in the Arduino IDE or actually copy and paste 😊
Program 1:
When you type your code, don’t forget to edit “Program 1” on the WiFi
parameters, Ubidots device parameters, and also on the Ubidots device and
variables label sections (See figure 37).

Figure 37. WiFi-Device parameters & Device-Variable label section
Tabel 3. Edit points on program 1

* Please refer Step 5 and Step 6 above.
If you have finished on your program typing and editing, next, compile/verify
and upload your program to your ESP32 board. Then test it.
Step 10: Hardware/Device Testing
To test your sensor device hardware, open Serial Monitor that available on
your Arduino IDE. Select “Tools” menu, the choose “Serial Monitor” option (See
figure 38).

Figure 38. Step to open Arduino IDE serial Monitor
Once you click the “Serial Monitor” option, Serial monitor window will be open
(See figure 39). In order you can see some information about your project
there, select the baud rate value on the baud rate drop-down (in this case,
the baud rate is 115200) and also press “Enable (EN)” button on your ESP32
board.

Figure 39. Hardware testing - WiFi connection and Published sensor data
If there is no error occur, on the serial monitor will display some
information as shown on figure 39, i.e.:
- Connected WiFi.
- WiFi IP address.
- Device connection information with Ubidots IoT cloud platform.
- Published Hall sensor data.
- Info if your system “Publishing data to Ubidots cloud.”
Step 11: Monitoring Hall-Sensor Data & Control LED on/from Ubidots
Dashboard
The last step is testing the whole project performance, i.e. Monitoring the
Hall-sensor data and control LED on/from Ubdots dashboard.
To make sure that the Hall-sensor data on the Ubidots dashboard and on the
actual sensing place (Record on Arduino IDE Serial monitor) have the same
value, its better if you compare the data by see the Hall-sensor data side by
side. Either on Ubidots dashboard or on Serial Monitor. See figure 40.

Figure 40. Monitoring Hall-sensor data on Ubidots dashboard & Serial
Monitor (Compare)
Then to control LED from Ubidot dashboard, try to click the switch widget and
see the LED on your ESP32 board, if it light-ON or light-OFF when the switch
widget clicked, its means that you have been successful publish
command/instruction from Ubidots dashboard (IoT cloud platform) to your device
(ESP32 board).

Figure 41. Realtime monitoring Hall sensor & control LED on Ubidots
dashboard
Figure 41, showed the real-time monitoring of Hall-sensor data (Hall effect)
on Ubidots dashboard and switch widget to control LED.
If you have reached on this point, congratulation!
Its means that you have published Hall-sensor data (also control the internal
LED of ESP32 board) to Ubidots IoT cloud platform using MQTT protocol
successfully.
0 comments:
Post a Comment